
This article explores data used in our article ‘Colder Weather and Higher Usage Lead to Power Bill Sticker Shock’ published on Feb 6th, 2025 on the Randolph Hub. You can read that article here.

ASHEBORO N.C. (ACME NEWS) — To get to the bottom of the recent spike in energy bills, we dug into a ton of data—everything from weather patterns and customer usage to historical energy pricing. While most of that data didn’t make the cut for the article, it helped us piece together the bigger picture. In this deep dive, we’re breaking down what we found.
First, it got cold 🥶
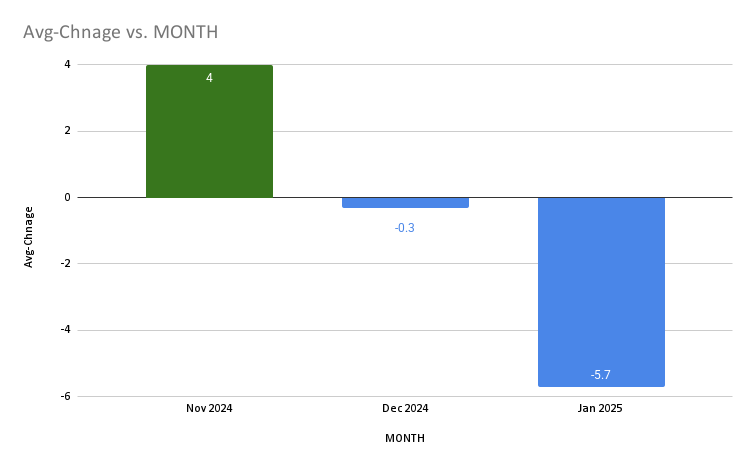
In both October and November, Greensboro and Raleigh experienced warmer-than-normal temperatures. This trend, however, shifted in December, which brought a split in temperature patterns. Temperatures were slightly cooler than normal, but only by 0.3 degrees—a minimal variation.
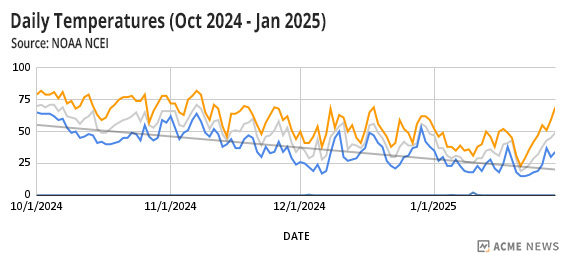
While official numbers for January hadn’t been finalized when we spoke Meteorologist Tom Green at the National Weather Service Office in Raleigh and pulled the weather data on Jan 31, preliminary data showed Greensboro averaging 34.0 degrees—or 5.7 degrees below normal.
This places January 2024 as the 16th coldest January on record, with records dating back to 1903. The last time Greensboro experienced a month with an average temperature below 34 degrees was in 2014 (33.5 degrees), and before that, in 1988 (32.9 degrees). The coldest January on record for Greensboro was 26.6 degrees in 1977.
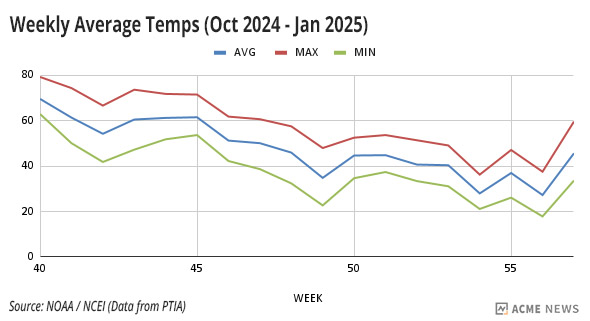
The trend downward of temperatures is even easier to see when you graph the averages for each week.
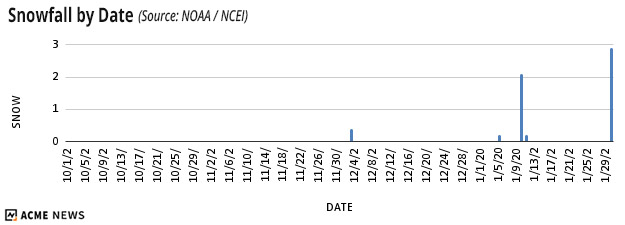
PTIA’s weather station recorded a total of 2.9 inches of snowfall. While Greensboro saw more snow than areas farther south, we focused on the timing of the snowfall, the majority of which occurred in January, which was already a colder month. This added to the overall winter weather conditions and increased the demand for heating.
A special thank you to Meteorologist Tom Green at the National Weather Service Office in Raleigh for his help with the climate summary.
Cold temperatures drove higher usage 📈
We found that cold temperatures were the main driving factor behind higher energy usage. Using data provided by customers, we graphed the minimum, median, average, and maximum usage across all three months.
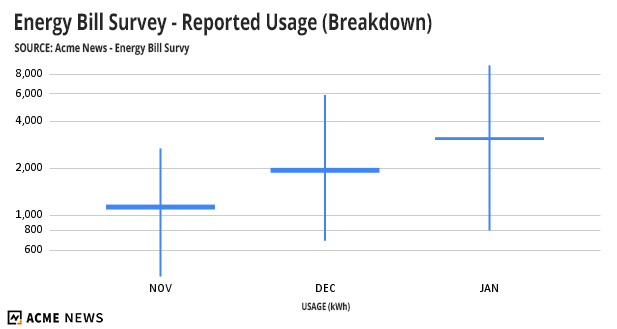
The graph sows the trend of usage increasing, each month:
- Minimum reported usage jumped 97%, from 406 kWh in Nov to 800 kWh in Jan.
- Average reported usage jumped 169%, from 1,154 kWh in Nov to 3,111 kWh in Jan.
- Maximum reported usage jumped 239%, from 2,677 kWh in Nov to 9,080 kWh in Jan
When you graph the median usage, along with the weekly low temperature to reveal trends, the relationship between colder temperatures and higher usage becomes more clear.
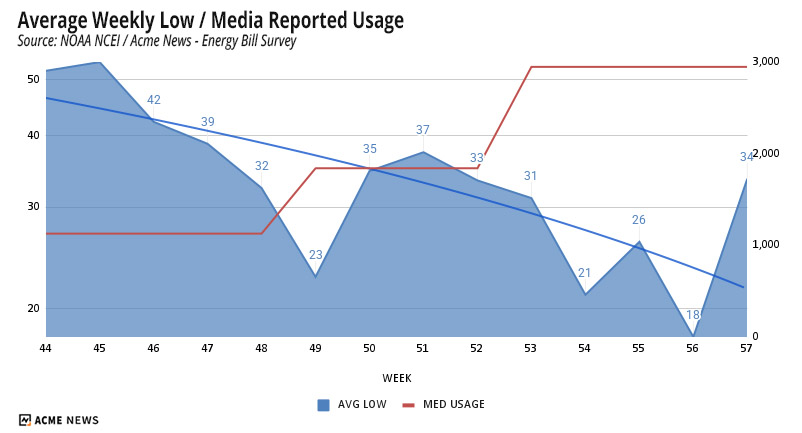
The graph above shows the weekly average low temperature reported at PTIA using ISO week on the left axis, and the median reported usage for the months of Nov, Dec, and Jan on the right axis. In this version of the graph, we’ve added a trend line (darker blue) which shows the trend of the dropping temperatures.
As temperatures fall, usage, goes up across the board.
Energy prices are higher, despite a recent dip⚡
Duke Energy, uses a two rate system meaning customers pay a different rate based on the amount of their usage. Right now, for Duke, that is:
- 12.119¢ per kWh for the first 800 kWh
- 11.119¢ per kWh for the additional kWh
Our survey gathered data on total energy usage (in kWh) and total energy costs. Since the data combined two different rates, we calculated an ‘effective calculated rate’ (ECR) by dividing the total energy costs for each month by the total kWh usage for that month. This gave us a balanced average rate for comparison. When graphed, the ECR shows a decrease in rates between November 2024 and January 2025.
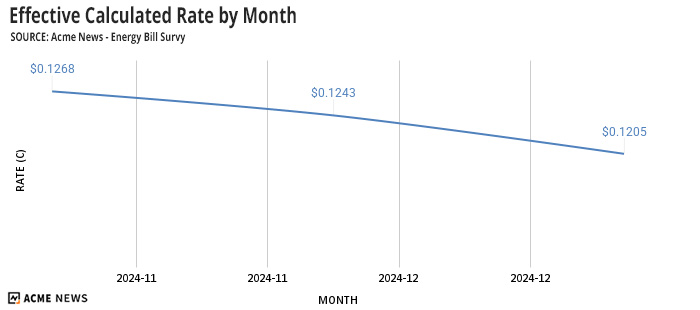
Our data shows that the ECR fell by 5%, which matches closely with the 4.5% rate decreased that Duke announced over the same period.
Overall, however, energy rates are up.
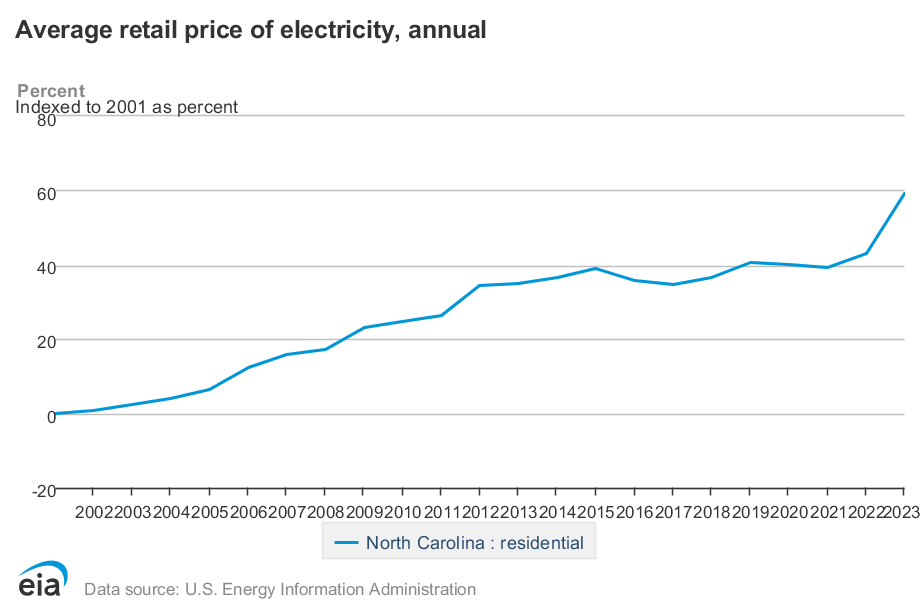
Stepping back six years to 2017, data from the U.S. Energy Information Administration (EIA) shows that the average retail price of residential electricity per kWh rose from 10.68 cents per kWh to 14.35 cents per kWh , an increase of 19%.
Duke Energy says a drastic increase in fuel prices between 2021 and 2024 was a driver of rate increases in the period. “At one point within that timeframe, the fuel costs to generate electricity at power plants more than tripled over a single year. Such increases impacted all utilities across the nation. Conversely, when fuel prices fall, we pass along the savings to our customers, as occurred in December. Fuel adjustments occur annually and are separate from base rates,” said Caroline, a spokesperson for Duke Energy in an e-mail.

In October 2022, DEP filed a base rate case in North Carolina—the first since 2019.
“Since our previous rate case in 2019, we had invested more than $3 billion in our generation, transmission and distribution infrastructure to strengthen the grid against storms and reduce outage times; advance the clean energy transition, including compliance with federal and state regulations; and maintain the high level of reliable service that our customers and communities expect,” said Duke in an email.
To cover these past investments, and an additional $3.3 billion in future upgrades, Duke proposed a gradual rate increase over three years through a Multiyear Rate Plan (MYRP). The North Carolina Utilities Commission (NCUC) approved by the NCUC in October 2023. For residential customers, this meant:
- A 2.9% interim increase in June 2023,
- A 4.9% increase in October 2023, and
- A 3.9% increase scheduled for October 2024.
According to Duke Energy; a typical residential DEP customer in North Carolina pays $154.63. 11% below the national average of $174.21 – a difference of approximately $235 per year.
The trend upwards of retail energy rates is even more dramatic when you look at the rates going back to 2001 . Over the 23 years between 2001 and the end of 2023 (where data from the EIA ends) N.C. retail energy rates are up 59.24%.
💳 Did extra fees play a (significant) role?
Many customers suspected that increased fees had a role in driving up bills. We don’t think this is the case. While the average paid in total fees went up between Nov 2024 and Jan 2025, the percentage of the total bill that accounts for the fees dropped.
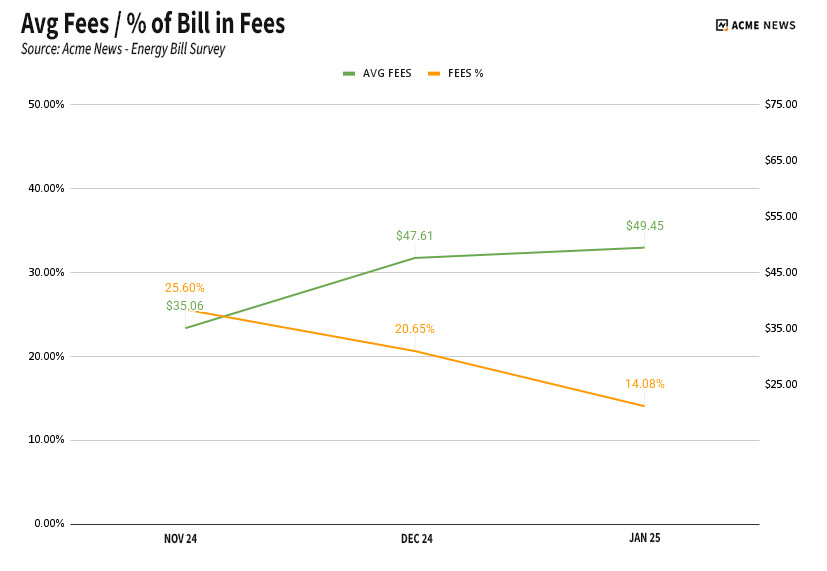
Looking at the graph, you’ll see that:
- In Nov of 2024 – The average customer paid around $35 in fees on their bill, making up 25% of the total bill.
- In Jan of 2025 – The average customer paid almost $50 in fees on their bill, making up only 14% of the total bill.
The Summary of Rider Adjustments is a list of extra charges allowed by North Carolina law. These charges can change at different times during the year and cover various costs, such as:
- Fuel costs, which vary each year and are different from the base Energy Charge.
- Programs to manage energy use and improve efficiency (DSM/EE).
- Renewable energy expenses.
- Assistance for low-income households to help pay their electricity bills.
- Refunds for overpayments due to lower income tax rates.
These charges are calculated per kilowatt-hour (₵/kWh) and are added to your monthly energy bill based on your electricity usage.
Duke Energy explained that the 5% rate decrease was due to lower fuel costs. Since fuel costs are included in the Summary of Rider Adjustments—which is based on usage and rates—it makes sense that even though total fees might be higher, the portion of your bill made up by these fees decreased overall.
Some customers noticed multiple riders on their bills. If you see two riders, you are not being charged twice. Riders are updated once a year, but these updates may not align with your monthly billing cycle. For example, if your billing period spans the date when a rider changes, you might see two separate rider charges reflecting the old and new rates.
For example, DEP’s fuel rider is updated every December 1. If your billing period runs from November 15 to December 15, part of your energy usage would be billed at the “old” fuel rate, and the rest would be billed at the “new” rate. This means you might see two separate charges on your Summary of Rider Adjustments for that billing period.
Additionally, prior to 2023, the riders were simply included in the overall Energy charges. In 2023, following changes to state regulations, DEP and DEC changed their bill format with these rate cases to provide greater bill transparency. So, these fees have always been on the bill, now they are just separated for transparency.
The other charge mentioned by residents was the storm recovery fee. This small, fixed charge is spread across all customers over several years. While it slightly increases bills, it has not been a major factor in recent increases.
Duke Energy currently holds approximately $1.1 billion in bonds to cover storm costs from hurricanes and ice storms over the past decade. The company plans to seek regulatory approval to issue additional bonds to recover hundreds of millions of dollars in expenses from Hurricane Helene, which heavily impacted western North Carolina. If approved, customers could see an additional storm recovery charge on their bills beginning in late 2025 or early 2026.
When asked about Storm Recovery Charges, Duke pointed to the following press release:
https://news.duke-energy.com/releases/storm-bonds-save-300-million-for-duke-energy-customers-in-north-carolina
We found these sites useful for understanding your power bill:
⚠ Energy Assistance Resources
We put together a list of resources that have everything from programs for those experiencing a heating or cooling related crisis to payment plans, and tips for lowering your bill. You can find that page here.
✅ A bit about the data
We used several techniques for preparing and validating data. Entries from our survey in which customers were on special billing plans which cap usage or costs as well as customers who were paying a special rates or were receiving discounts, or did not provide a full data set were removed from the dataset prior to analysis.
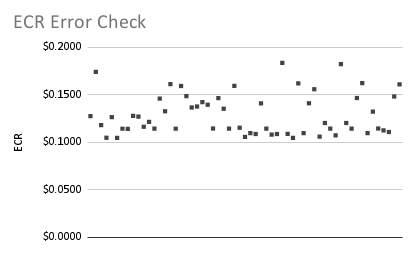
One of the ways in which we checked the data was by graphing the ECR for all customers and ensuring resulting ECRs were within a valid range.
If you are a journalist or a researcher and would like access to an anonymized dataset, reach out to the news desk.
###